Define The Problem
The first step in the problem solving and decision making process is to identify and define the problem. A problem can be regarded as a difference between the actual situation and the desired situation. “A problem well stated is a problem half solved” is a common phrase in the problem-solving field attributed to former GM executive Charles Kettering (Willingham 1999, 162). That is, rather than jumping to conclusions, if we take the time to ensure that we have a clear understanding of what the problem really is (or isn’t), it will save a lot of time further on that might have been wasted. For instance, do you think that it is problem?
“Actual Situation” Vs “Desired Situation”
70% Fees Collection Vs 100% Fees Collection
Once the specific problem to work on has been identified, a clear, concise, and complete problem statement should be developed. A good problem definition can help make the diagnosis more focused and productive. The components of a good problem statement should include the following:
What: A description of what happened (that shouldn’t have) or didn’t happen (that should have), or what happened that the organization would like to see happen again, or simply what change in performance is desired.
Where: Where specifically the problem was found. Note that this could be geographic, and/or where in the process, and/or location on the product.
Who: If the problem directly affects an individual or group of people, “who” often becomes an expansion of, or replacement for, “where.”
When: When the problem was first found and/or when it began (if known).
How much: The frequency and/or magnitude of the problem. Numbers provided should be absolute values (plus percentages if useful for normalizing the data).
Outcome
Problem Statement of “Late Fees Submission”
“10% of leaners’ parents at ABC Educational institution are not submitting the tuition fee (Educational institution Fees) in accounts department for last six months”.
— OR —
“30% of leaners’ parents at ABC Educational institution are submitting the tuition fee (Educational institution Fees) late (i.e., after deadline) in accounts department for last six months”.
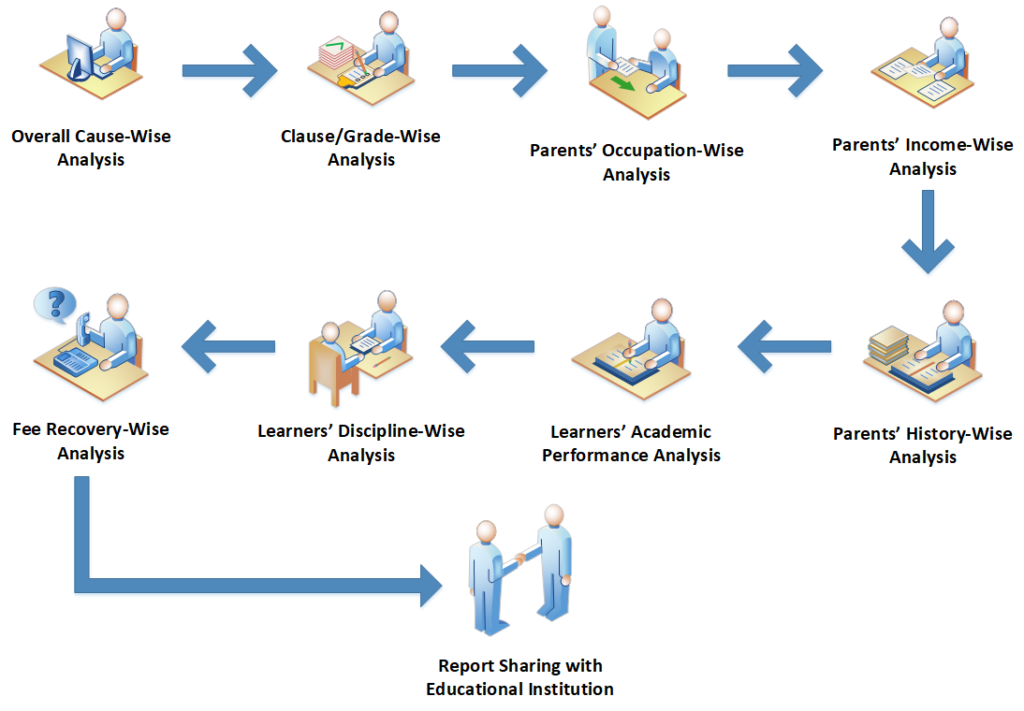
How we do it?
The activities that we make up in this process are not random or ad hoc; they are related and organized. All the activities in the process work together toward a common goal. Processes exist to achieve results valued by internal and external customers. We follow ISO standards that defines the process as “set of interrelated or interacting activities which transforms inputs into outputs”.